The Test in Five Steps
Understanding Link Budget
A fiber link budget is the maximum total loss the link can have and still operate within the receiver's specifications. Every fiber transmitter has a launch power; every receiver has a sensitivity. The difference between launch power and sensitivity is the available budget. Loss in the link consumes budget. If loss exceeds budget, the receiver does not see enough signal to decode reliably.
Engineered link budgets are calculated during network design based on:
- Fiber attenuation: typical single-mode 0.35 dB/km at 1310nm, 0.22 dB/km at 1550nm; multimode 3 dB/km at 850nm, 1 dB/km at 1300nm
- Splice loss: 0.05 to 0.1 dB per fusion splice (use 0.1 in budget); 0.2 to 0.5 dB per mechanical splice
- Connector loss: 0.3 to 0.5 dB per pair; UPC connectors slightly better than APC for insertion loss
- Splitter loss (PON): ~17 dB for 1:32, ~21 dB for 1:64, plus 0.5-1 dB excess loss
- Margin: 1-3 dB safety factor for aging, future repairs, environmental variation
Step 1: Calculate Your Budget
Before testing, calculate what the link should measure. Without a target, you cannot evaluate the result.
Worked Example: Single-Mode Backbone, 8 km
- Fiber attenuation: 8 km x 0.35 dB/km at 1310 = 2.8 dB
- Fiber attenuation: 8 km x 0.22 dB/km at 1550 = 1.76 dB
- Splices: 8 (one per kilometer in spliced sections) x 0.1 dB = 0.8 dB
- Connectors: 4 (2 patch panels at each end) x 0.5 dB = 2.0 dB
- Margin: 2 dB
- Total budget at 1310: 2.8 + 0.8 + 2.0 + 2.0 = 7.6 dB
- Total budget at 1550: 1.76 + 0.8 + 2.0 + 2.0 = 6.56 dB
Worked Example: FTTH Drop, 300m
- Fiber attenuation: 0.3 km x 0.35 dB/km = 0.105 dB
- Splices: 1 x 0.1 dB = 0.1 dB
- Connectors: 2 x 0.5 dB = 1.0 dB
- Margin: 1 dB
- Total budget: 0.105 + 0.1 + 1.0 + 1.0 = 2.2 dB
Now you have a target. The measurement must come in below this value to pass.
Equipment Required
Calibrated Light Source
For single-mode work, a 1310/1550 nm dual-wavelength source. For multimode, an 850/1300 nm source with proper LED launch conditions or a VCSEL source for tight tolerance work. The source must be calibrated at the same wavelengths as the meter.
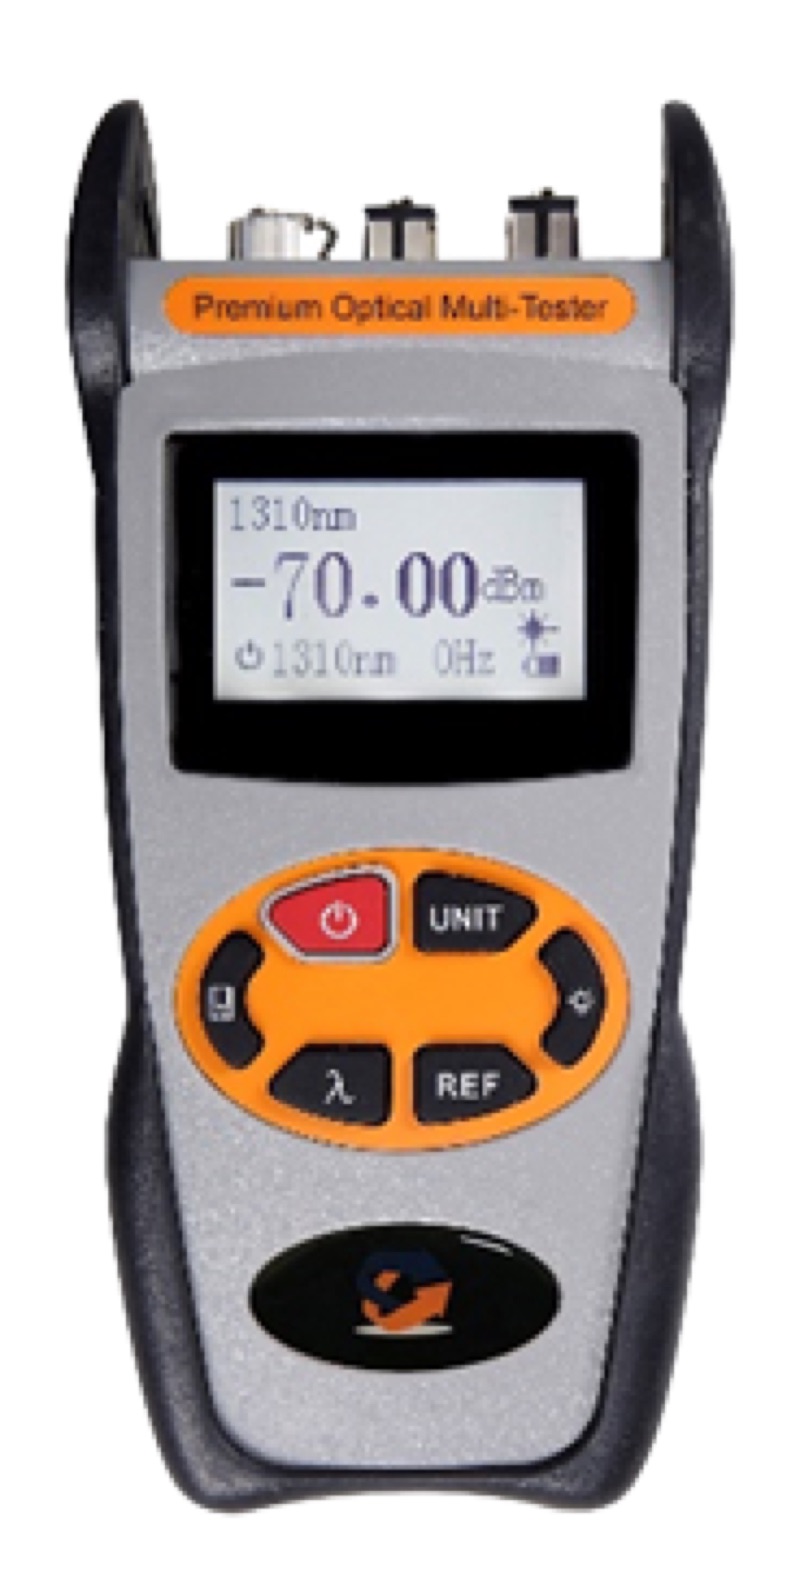
Calibrated Power Meter
A meter matching the source wavelengths. The Optical Power Meter LC ($79.99) handles standard single-mode and multimode wavelengths. For PON-specific testing on live fibers, use a PON meter like the XGS/GPON Power Meter ($484.99).
Launch and Receive Cords
Single-mode launch cords like the LC/UPC duplex single-mode patch cord or SM LC/APC duplex jumper. Length is typically 1-3 meters; the cord type must match the connector at the fiber under test.
Connector Cleaning Kit
Click cleaners for the connector types you will encounter, alcohol wipes, and a fiber inspection scope. The complete Fiber Cleaning Kit covers SC/FC/ST/LC ferrules.
Documentation Method
Test results spreadsheet, mobile testing app, or formal test report template. At minimum you need to record fiber ID, both directions, both wavelengths, and the date.
Step 2: Reference the Source
The reference establishes the meter's zero point relative to the source output. Without a reference, you are measuring absolute power but not insertion loss.
Single-Cord (One-Jumper) Method
- Clean both ends of the launch cord and the meter port
- Connect the launch cord between the source and meter
- Power on both, set wavelength on both
- Wait 30 seconds for source stabilization
- Press the meter's reference (REF or dB) button
- Meter now reads 0.00 dB at the reference wavelength
This is per TIA-526-7 (single-mode) or TIA-526-14 (multimode). Single-cord method counts only the launch connector loss in the reference, providing the most repeatable measurement.
Disconnection Rules
After referencing, disconnect at the meter side only. The source-side connection is now part of your reference. If you disconnect at the source, the next reconnect changes that joint's loss and invalidates the reference. If you accidentally disconnect at the source, redo the reference.
Step 3: Measure the Fiber Under Test
Connect the Fiber
Disconnect the launch cord from the meter. Clean the launch cord ferrule, the patch panel port at end A of the fiber under test, and connect them. Walk to end B (or use a second tech), clean the patch panel port and the receive cord, connect them. Connect the receive cord to the meter.
Read the Loss
The meter displays the total loss of the path: launch cord connection at the source side (already in reference), the connector at end A, the fiber, all splices, the connector at end B, and the receive cord connection to the meter. Record this value.
Switch Wavelength
For single-wavelength meters, change both the source and meter to the next wavelength (1310 to 1550, or 850 to 1300). Re-reference if your meter does not store separate references per wavelength. Take the second wavelength reading.
Multi-Wavelength Source
If using a dual-wavelength source and a dual-wavelength meter, both wavelengths display simultaneously. Record both values.
Step 4: Bidirectional Test
The single-direction measurement is half the test. Connector asymmetry can skew the result. Repeat from the opposite direction.
Procedure
- Move the source to end B and the meter to end A
- Re-reference the source at end B with a launch cord
- Connect the launch cord to the patch panel at end B
- Connect the receive cord between the patch panel at end A and the meter
- Read and record loss at each wavelength
- Compare A-to-B and B-to-A readings -- they should agree within 0.3 dB
Calculate the Average
Average the two directions: (A-to-B + B-to-A) / 2 = bidirectional average loss. This is the value to compare against the link budget. If the two directions disagree by more than 0.5 dB, suspect dirty connectors or a bad splice and re-clean before re-measuring.
Typical Link Budgets by Application
| Application | Length | Wavelength | Typical Budget |
|---|---|---|---|
| FTTH drop (no splitter) | under 500m | 1310/1490nm | 1.5-2.5 dB |
| FTTH GPON 1:32 split | 1-5km from OLT | 1490nm DS | 22-28 dB total |
| FTTH GPON 1:64 split | 1-5km from OLT | 1490nm DS | 26-32 dB total |
| Campus single-mode | 1-2km | 1310/1550nm | 2-4 dB |
| Metro/OSP backbone | 5-20km | 1310/1550nm | 4-10 dB |
| Long-haul | 20-80km | 1550nm | 10-25 dB |
| Data center MMF | under 300m | 850/1300nm | 1-2.5 dB |
Step 5: Document and Compare
Required Test Record Fields
- Fiber identifier (cable ID + fiber number)
- Test date and technician name
- Source make/model/serial and last calibration date
- Meter make/model/serial and last calibration date
- Wavelength tested
- End A to end B loss in dB
- End B to end A loss in dB
- Bidirectional average loss in dB
- Engineered link budget in dB
- Pass/fail status
- Connector type at each end
- Notes (any unusual readings, retests, environmental conditions)
Pass/Fail Determination
If the bidirectional average is at or below the engineered budget, the link passes. If above the budget, the link fails and requires investigation -- typically a bad splice, dirty connector, or unaccounted bend.
Marginal Cases
If the measured loss is within 0.5 dB of the budget (so close to passing), re-clean every connector in the path and re-measure. Most marginal failures are connector contamination. A genuine fiber problem typically shows a much larger excess.
When the Link Fails Acceptance
If a measurement fails budget, the next step is troubleshooting to find the source of excess loss.
Order of Investigation
- Re-clean and re-measure. 60% of "fiber problems" are connector contamination. Click-clean every connector and patch panel port in the path.
- OTDR trace. Use the QBL Fiber Ranger Mini OTDR to identify which event in the path has excess loss. The trace shows splice and connector losses individually.
- VFL inspection. Run a VFL Pen 5km down the cable to find any visible faults: tight bends, kinks, leaking splices.
- Microscope inspection. Inspect every connector endface with a Wifi Fiber Microscope. Cracked, scratched, or pitted endfaces show clearly.
For a deeper troubleshooting workflow, see OTDR vs Power Meter: When to Use Each.
Frequently Asked Questions
What is a fiber link budget?
The maximum total optical loss between transmitter and receiver, in dB, calculated from fiber attenuation, splice count and loss, connector count and loss, and a safety margin. The measured insertion loss must come in below the budget for the link to pass acceptance and operate reliably.
How do I calculate my link budget?
Add fiber attenuation (length x dB/km) plus splice loss (count x 0.1 dB) plus connector loss (count x 0.5 dB) plus 1-3 dB margin. Example: 5km SM fiber with 4 splices and 2 connectors at 1310nm: 1.75 + 0.4 + 1.0 + 1.0 = 4.15 dB total budget.
What loss should I expect on a typical FTTH drop?
FTTH drops of 100-500m with 1-2 splices and 2 connectors typically measure 0.5-2 dB at 1310/1490nm. PON splitter loss (17-21 dB) is added separately for OLT-to-ONT total budget. Drops over 500m or with multiple bends and patch panels can reach 3-4 dB.
Why test bidirectionally?
Connector loss varies slightly with launch direction due to small core misalignments. Single-direction testing can over-report or under-report. Bidirectional measurement averages both directions, eliminating asymmetry. TIA-526 acceptance specs require bidirectional testing.
Do I need to test at both 1310 and 1550 nm?
Most single-mode acceptance specs require both wavelengths because attenuation differs and 1550nm is more bend-sensitive. Multimode testing typically requires 850 and 1300 nm. PON live network testing uses actual PON wavelengths (1490, 1310, 1577, 1270 nm) with a PON-specific meter.
Equipment for Link Budget Testing
- Optical Power Meter LC ($79.99) -- Standard wavelengths for SM/MM dark fiber loss testing.
- XGS/GPON Power Meter ($484.99) -- Live PON power verification.
- SM LC/UPC Duplex Patch Cord -- Launch and receive cords.
- Fiber Cleaning Kit -- Connector cleaning supplies.
- Fiber Ranger Mini OTDR ($579.99) -- For event-level loss when budget fails.
Related guides: How to Use an Optical Power Meter, Insertion Loss vs Return Loss, OTDR Basics.